This is the system you use in your appointment to present the numbers, the plan, the product, and close the sale. This is an offline version of the presentation.
You will learn and use 4 items in this presentation:
- The FreedomFlex Brochure
- The Future Income Chart
- The Time and Compounding Chart
- An All Age Illustration (Level 1 and Level 2)
step 1 – intro
Instructions
 Begin the presentation by reviewing their survey and estimate. Use the first page of the brochure and talk about the statistics on the right hand side of the page. Remind them why their is a need to save and accumulate money for retirement.
Example Script
Hi John and Mary, before we get started I would like to review some of the information from your survey. You selected that you are not currently doing anything to save for retirement and you selected $$$$ a week that you would be willing to contribute to put aside for savings, correct?
As I may have stated earlier, at best, social security will provide you with half of your income for retirement. In fact, the average retired worker receives $1,177 dollars from social security and 3.6 million senior citizens live below the poverty level. Do you understand that if you do not begin saving and accumulating money you could end up like these statistics? Do you want to attempt to live off of $1,177 a month?
What I want to do here today is go over how we got the numbers from your estimate and to show you how you can start accumulating money for retirement. We will cover three fundamentals for saving and accumulating and how to put them to work for you.
STEP 2 – retirement Income projections
Instructions
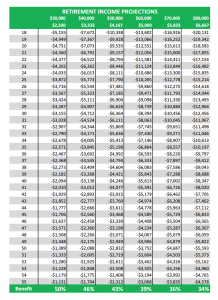 The second step is the predicting how much social security will leave them short. The Retirement Income Projection chart will provide that number for you. Simply select their age and round to the closest annual income number. The field will display what they can expect to be short after social security once they reach age 65.
If you are curious as to how we come up with these numbers you simply need to go to the RIC software and enter the prospects information and you can see how it is calculated. At the bottom of each column you can see what the percentage of salary social security will provide.
Example Script
John and Mary, this is a financial projection chart. It projects your net income after you receive social security as compared to your current income. At the bottom of each column you can see what percentage of income social security will provide. This calculation takes into account a salary inflation rate of 4% and a social security COLA adjustment of 3.88%. So with all of that being said, your retirement income will be $$$$$ short of your current standard of living. This means you will either have to greatly reduce your standard of living, or you will have to continue to work.
Now you may notice the number is larger than the monthly salary stated at the top. This is due to inflation. For example, a monthly salary of $2,500 now would end up being $7,892 after 35 years of 4% inflation. So let’s talk about accumulating money so you can make up the difference.
STEP 3 – Time and Compounding
Instructions
 The third step is to demonstrate for them the power of time and compounding interest. You want to make sure they understand how this works. They should begin getting excited in this step.
Example Script
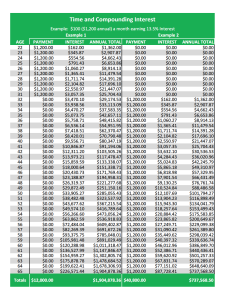
So John and Mary I want to show you the power of time and compounding. In fact, Albert Einstein stated that the most powerful mathematical discovery was the power of time and compounding. This is how you put your money to work for you and a simple hundred dollar a month under the right circumstances can turn into over a million dollars.
There are two fundamentals to pay attention to here. First, is the growth rate which we are illustrating at 13.5%. The second is how long the growth rate is applied. Example one, shows a person saving $100 a month ($1,200 annually) into an account that earns 13.5%. They do this from age 22 to 32, then quit saving and just let the money earn interest all the way to age 65. They end up having saved only $12,000 but they ended up with almost two million in principal in their nest egg. So, in order to achieve results like this you need access to a high growth rate like 13.5%. You simply cannot achieve this in a savings account at your local bank.
Now if you look at example two, you can see this person waited until age 32 to begin saving and saved all of the way to age 65. Despite saving more money, just over forty thousand, they accumulated less than half of the other person. The key here is how long they saved, every year counts.
So the two take aways for saving and accumulating is we need access to high growth rates, while also saving for as many years as possible. These are the two fundamentals that will determine how much you can accumulate. The only other one is how much you save.
STEP 4 – Illustration
Instructions
T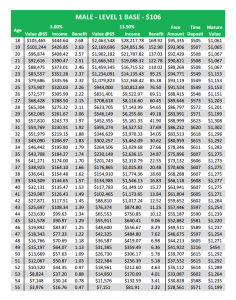 his step you will show them an all age illustration that matches the contribution they selected from their survey. You will show them what they can expect to achieve from the growth accounts and lay the foundation as to why there is insurance in the plan.
Example Script
So based on the $$$$ per week you selected on your survey you pre qualify for a plan called the FreedomFlex that can provide you with both guaranteed growth and high growth.
If you enrolled in the plan today and you chose to direct all of your growth side money into the guaranteed 3% annuity savings account you can end up with a nest egg of $$$$, providing a monthly income of $$$$. In this account you have complete access to your money at any time without any fees or surrender charges. You can also save additional money in this account at any time with no fees or charges.
The plan also provides a service option in the second year that allows you to redirect your money into an investment account of your choice. If you do not have one, the plan provides access to two top performing mutual funds with a 54 year average of 13.5%. If you chose to direct your money here you could end up with a nest egg of $$$$$, and a monthly income of $$$$$.
Both of these account give you the ability to make up the $$$$ you will be short after social security. Now this is a very unique plan because if you were to get sick or hurt and cannot work, this would probably be one of the first things you would stop paying, so if you qualify, the plan provides insurance protection benefits, so your monthly contributions into your growth accounts would be made for you so the nest egg would still be there. Would you like to see more about how this plan works?
STEP 5 – THE BROCHURE

Instructions
In this step walk them through the brochure and answer any questions they might have. Watch this video on how to do present the brochure. Continue watching until this become natural for you. After this step move on to plan options just like the online presentation.
